Excel and Sheets dashboards for revenue, projects, people and KPIs. 5 projects in this category.
Projects shown here are sample work created to demonstrate our approach. Some samples show only a partial preview rather than the full file — this is intentional, to protect the complete structure, formulas, and design system. Request a project and we'll walk you through the rest.
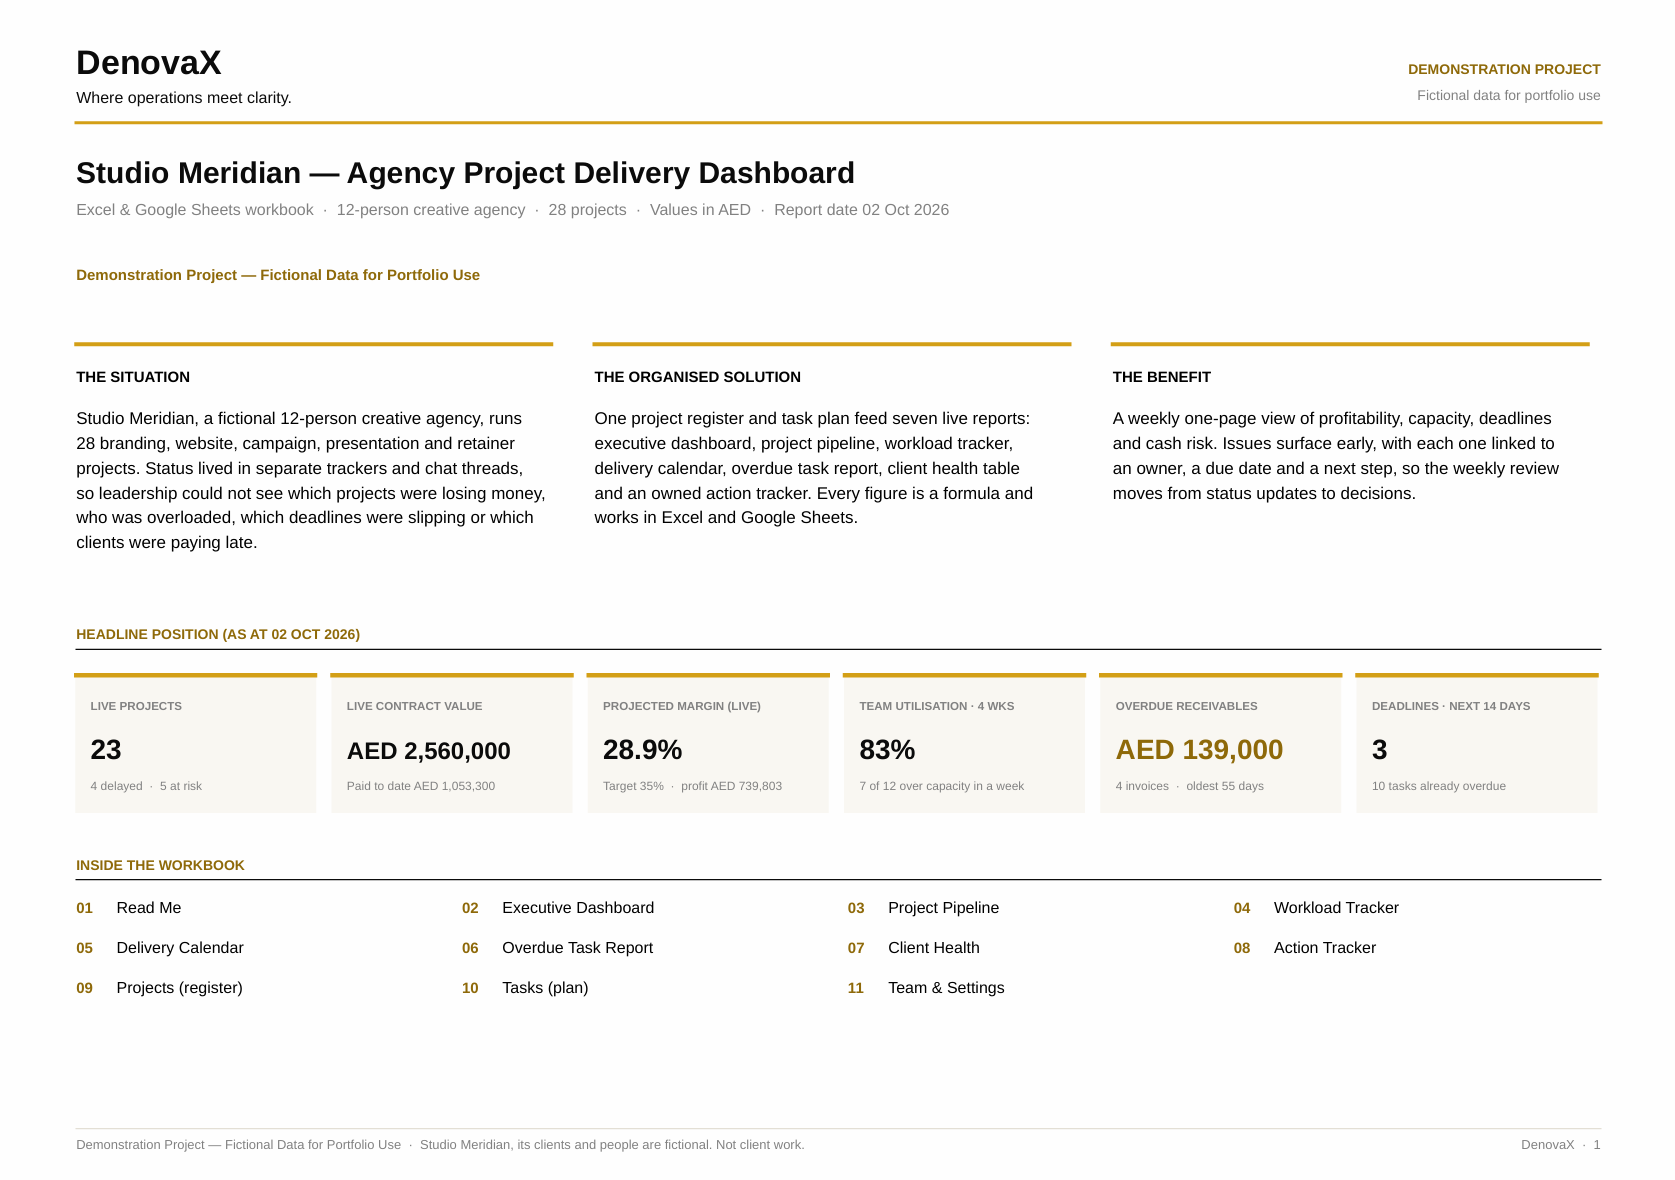
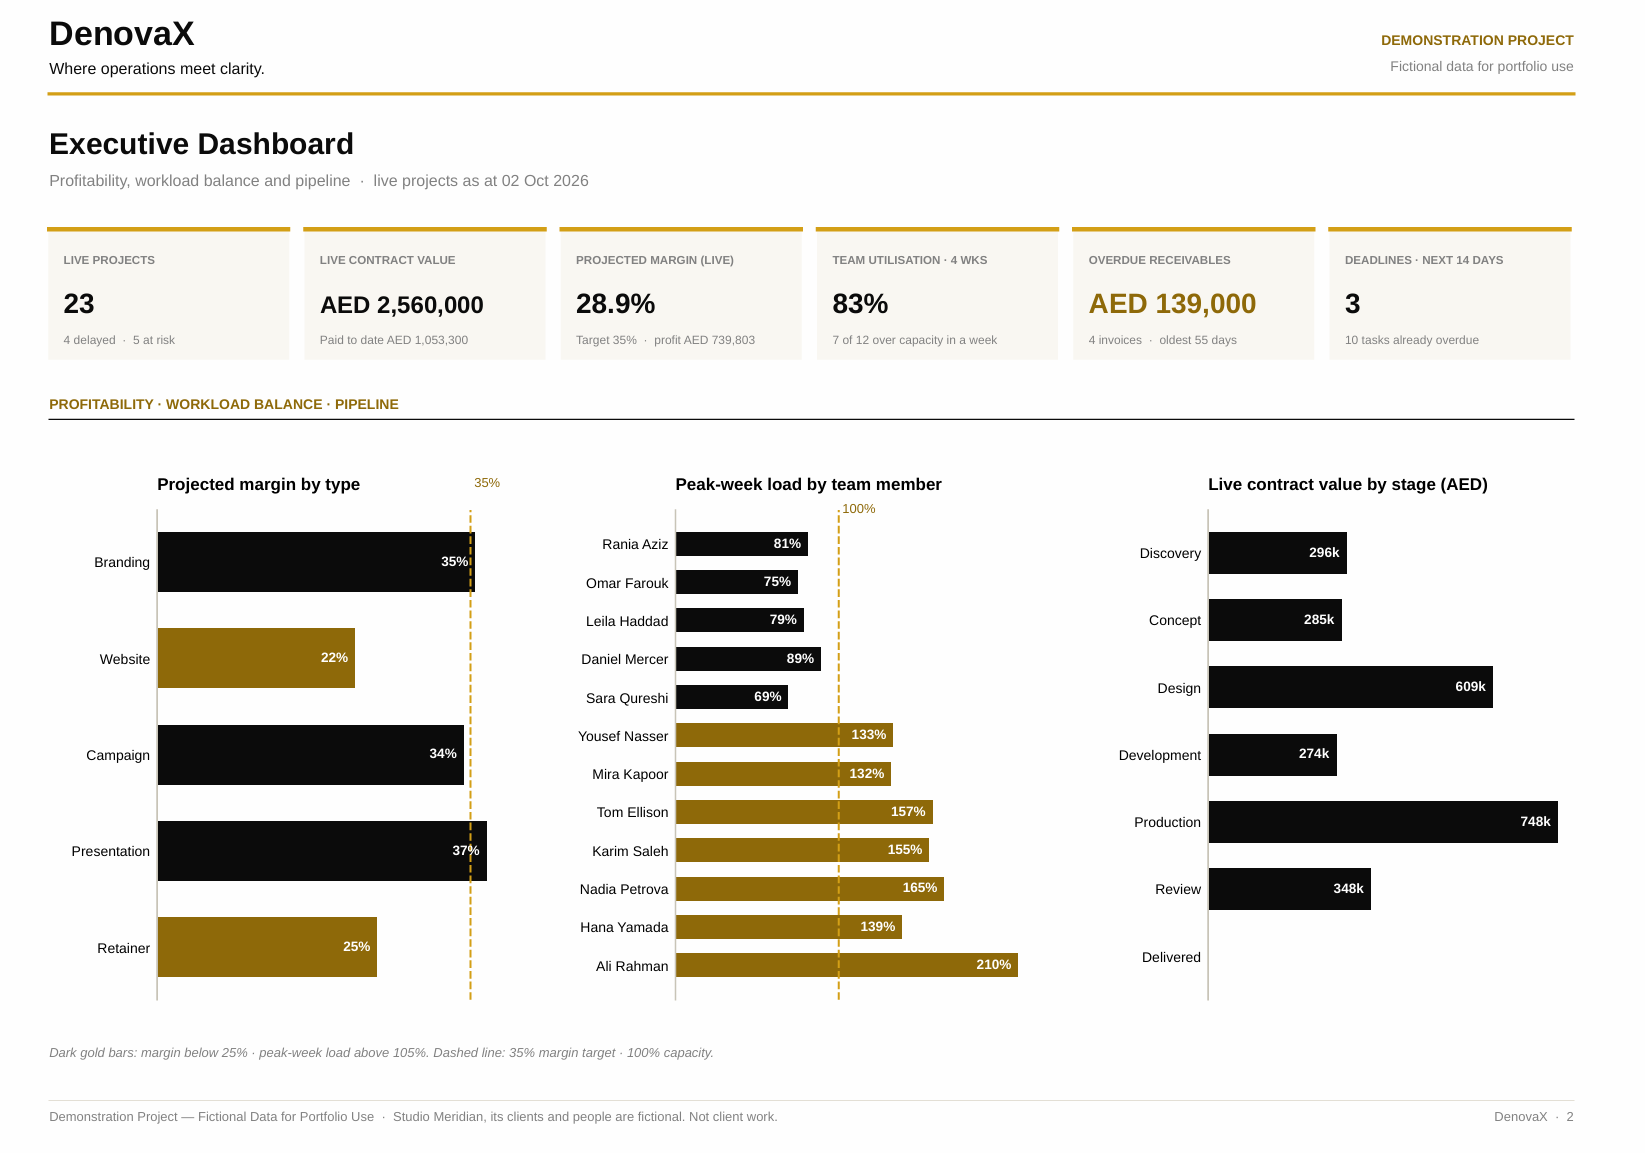
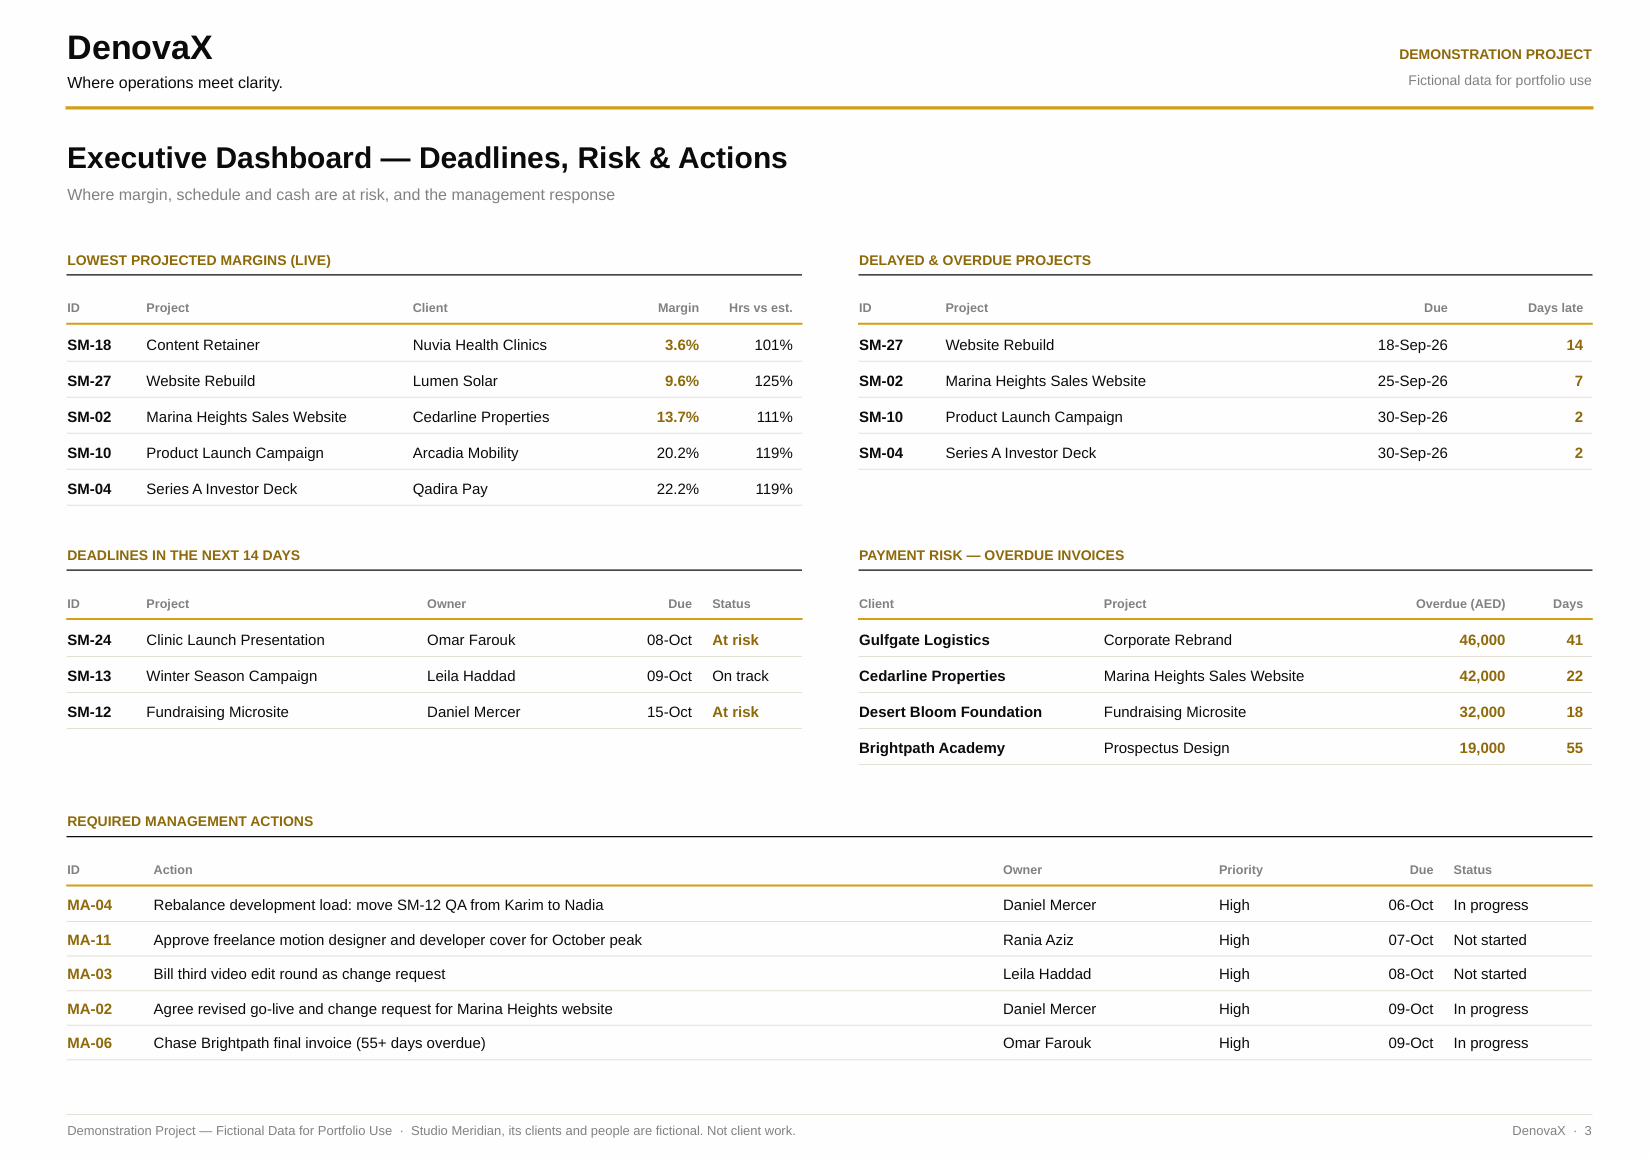
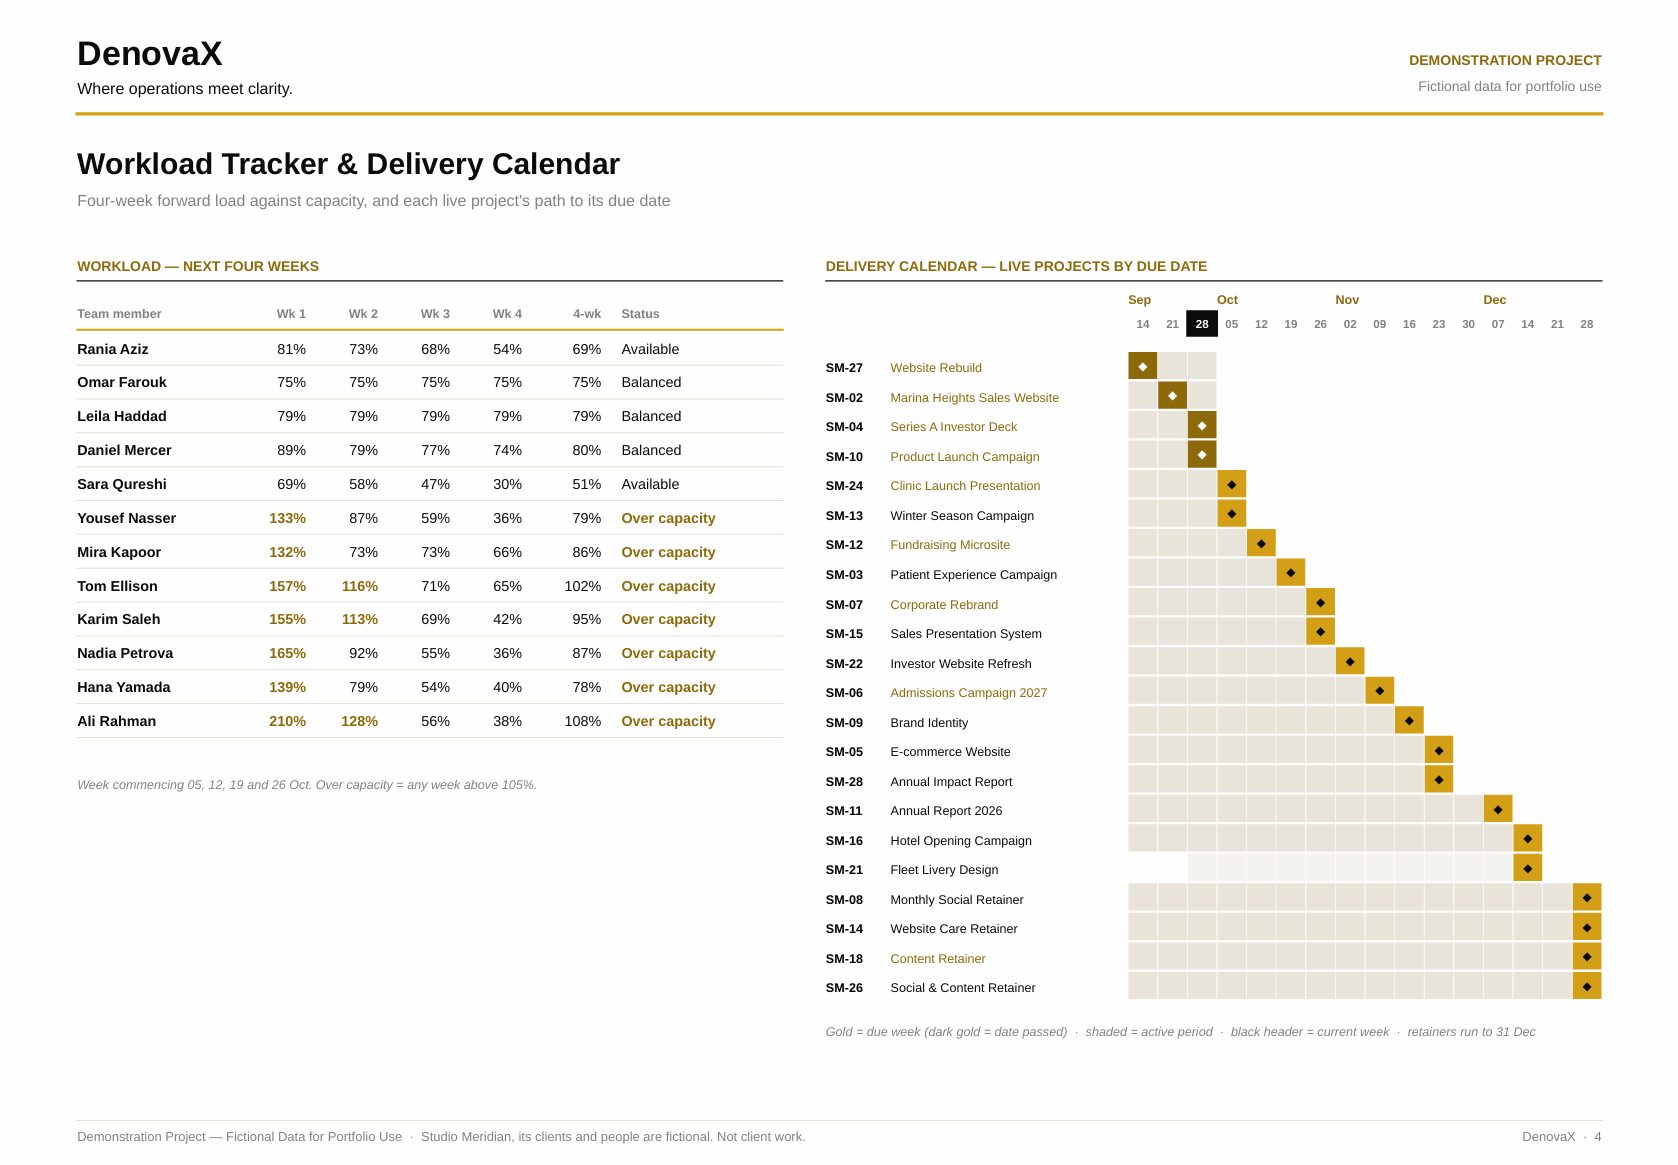
Studio Meridian — Agency Project Delivery Dashboard
An Excel & Google Sheets workbook for a 12-person creative agency: one project register feeding a live executive dashboard, workload tracker, delivery calendar, client-health table, and owned action tracker — every figure a formula.
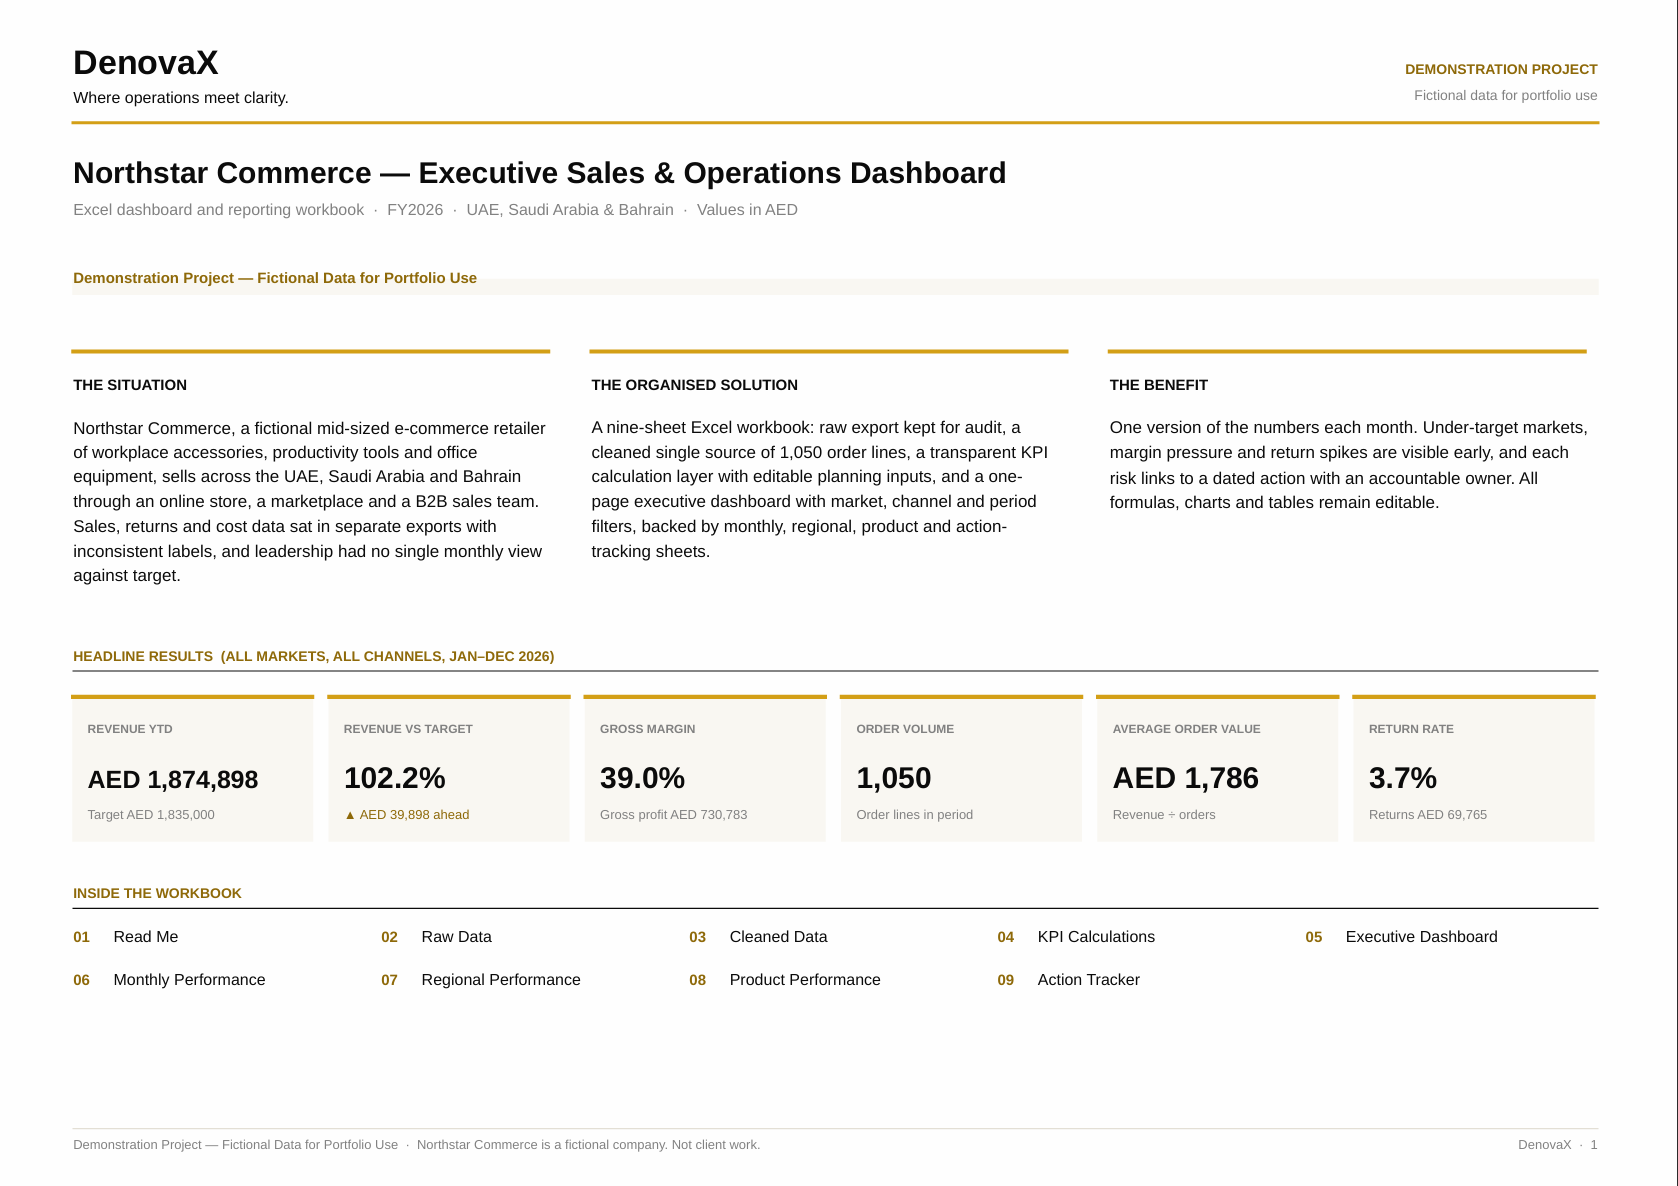
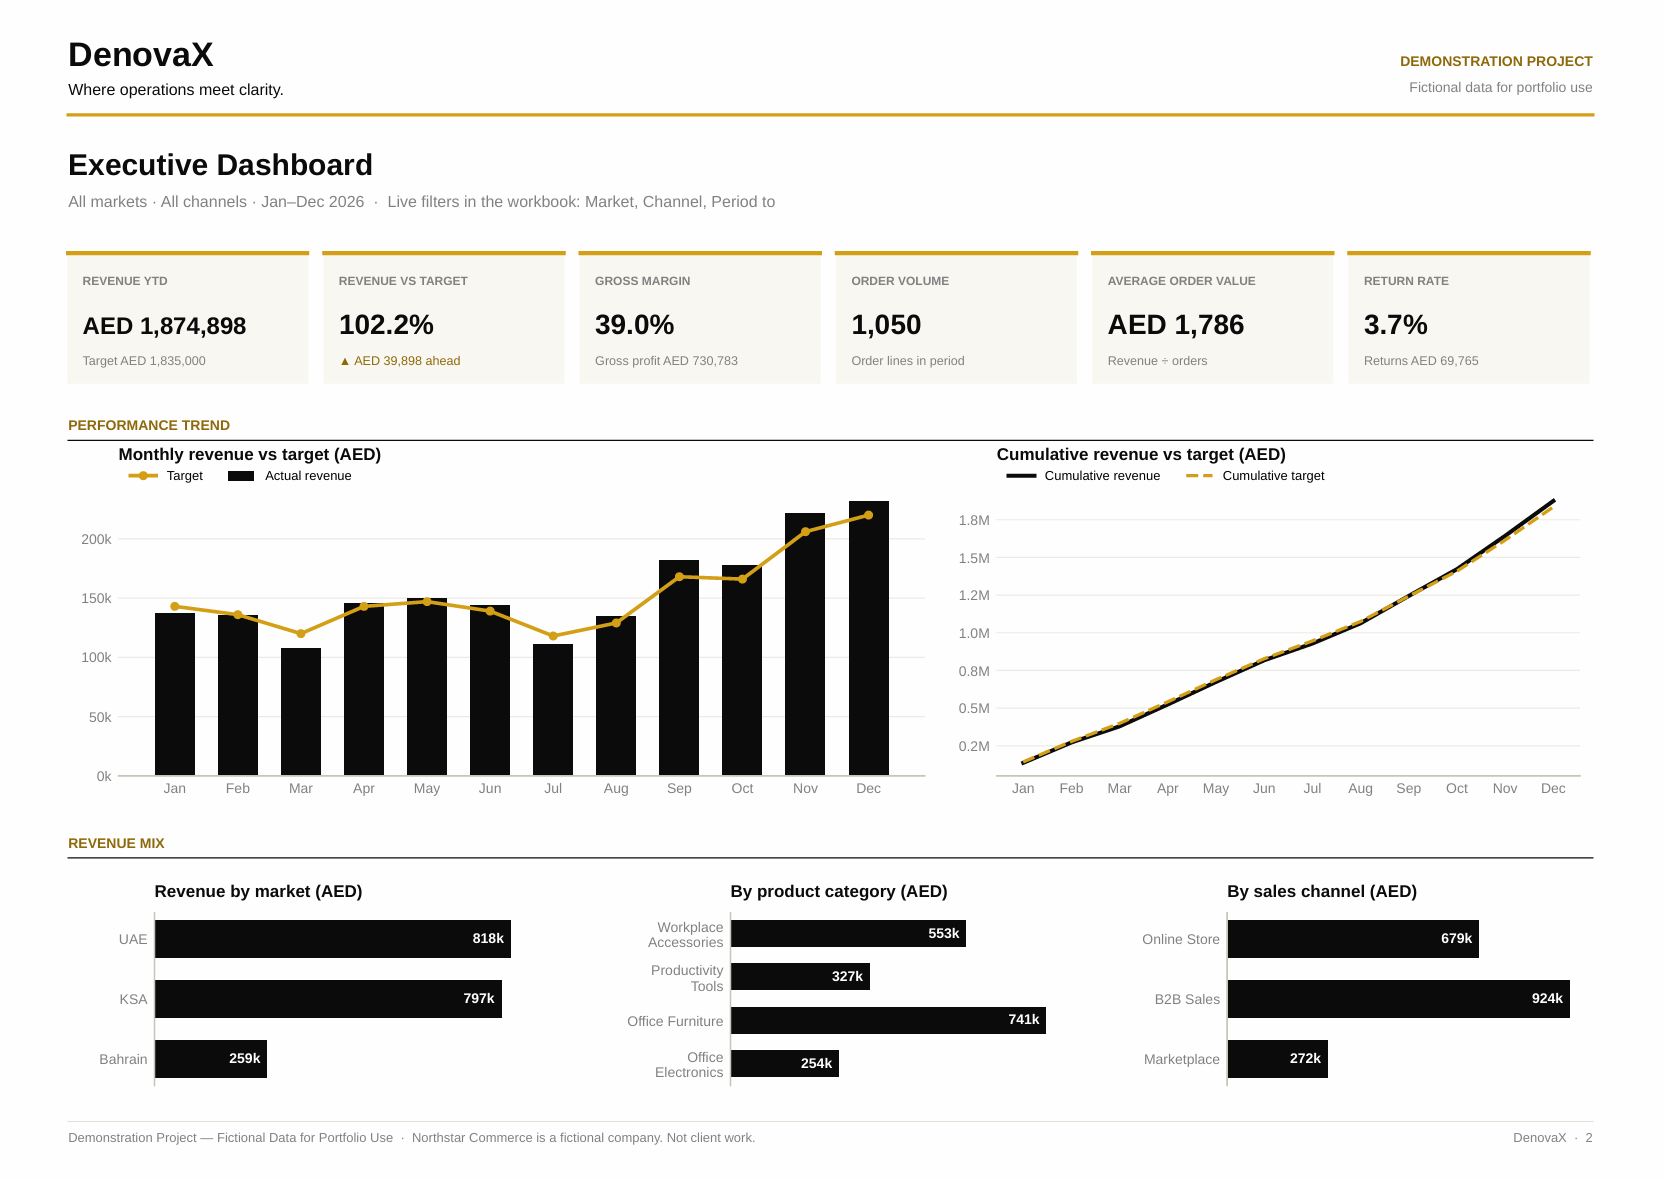
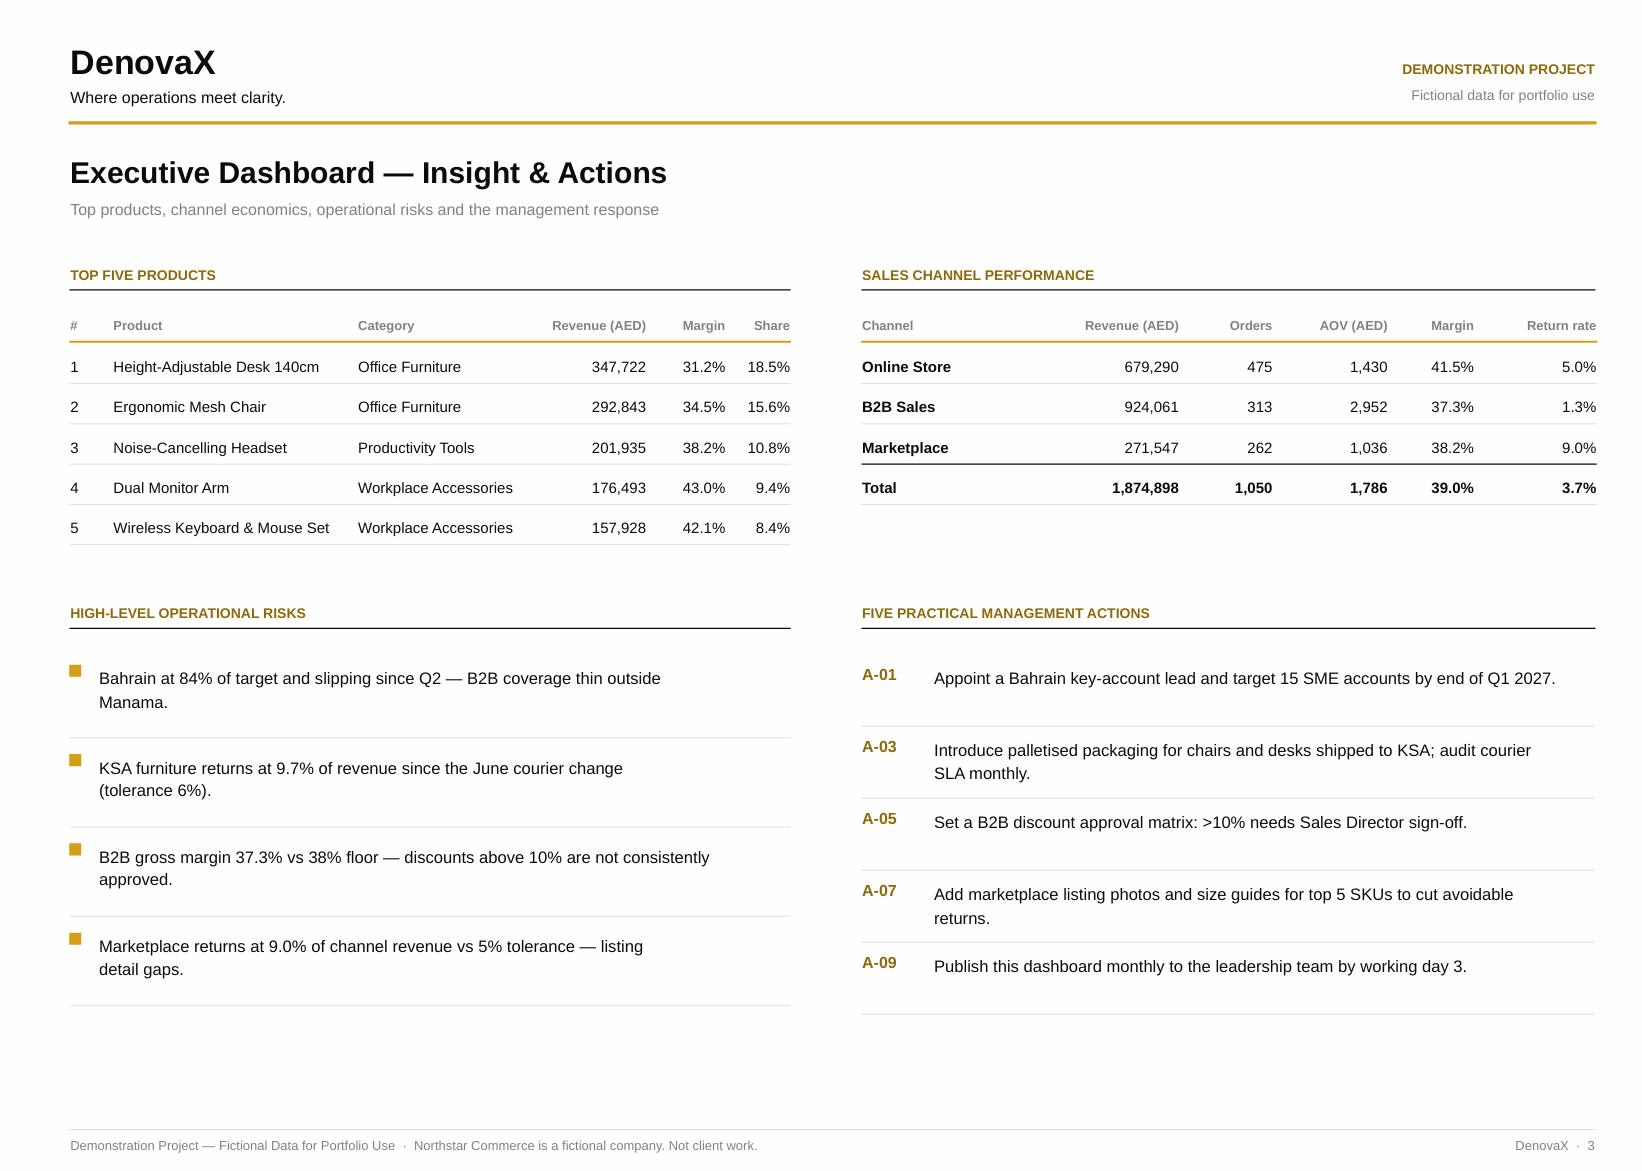
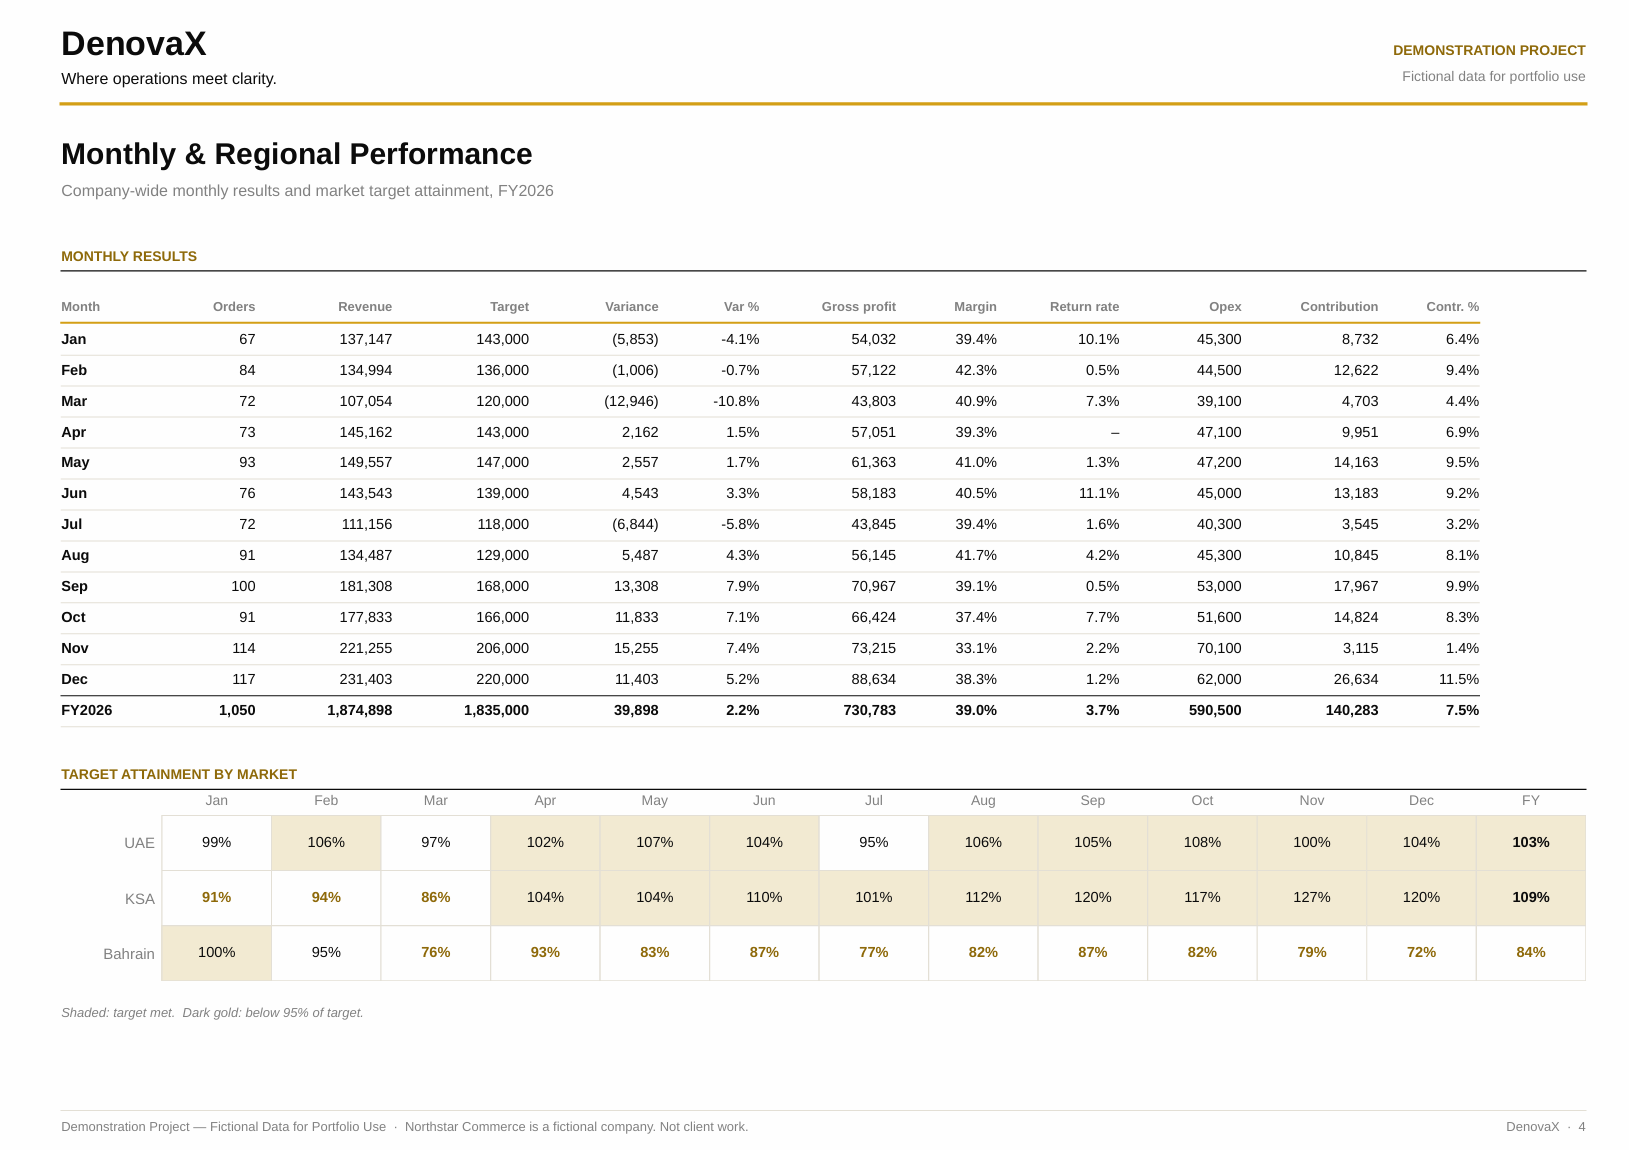
A nine-sheet Excel workbook for a multi-market e-commerce retailer: raw export, cleaned single source of 1,050 order lines, a transparent KPI layer, and a one-page executive dashboard with market, channel and period filters.
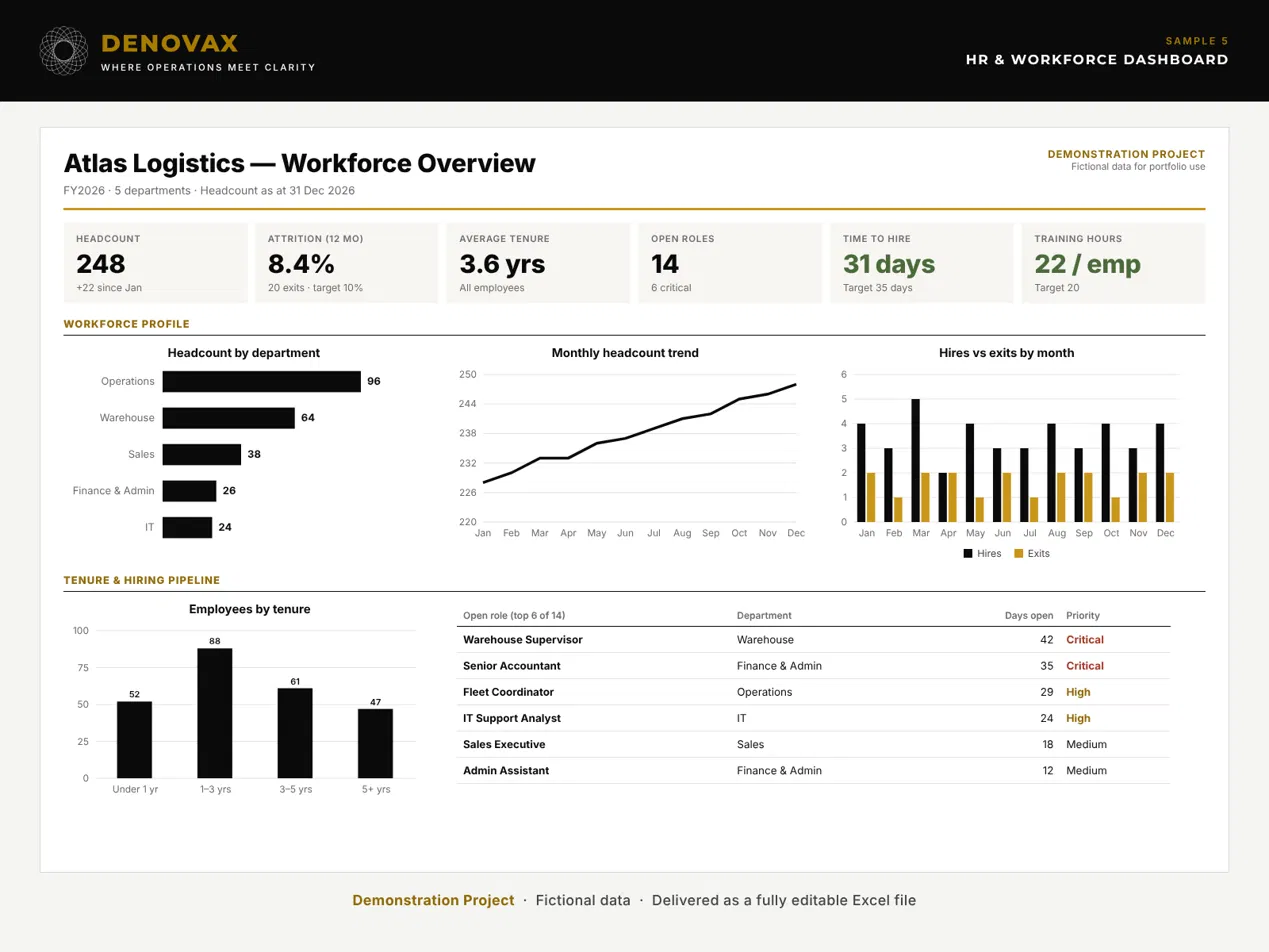
Demonstration project — fictional company, fictional data. A one-page workforce overview: headcount, attrition, average tenure, open roles, time to hire and training hours, with headcount by department, monthly trend, hires versus exits, tenure bands and the open-role pipeline. Delivered as a fully editable Excel file.
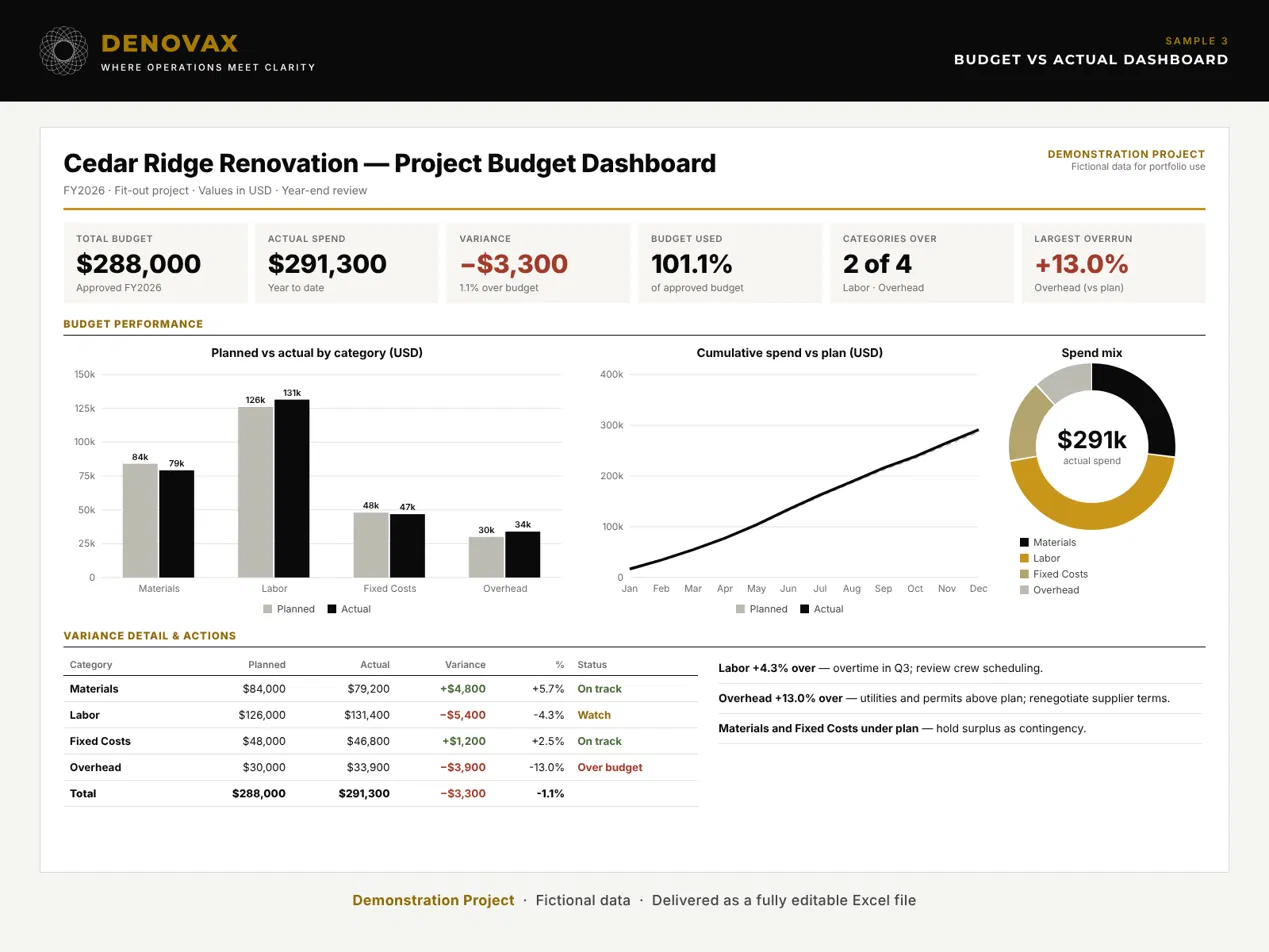
Demonstration project — fictional project, fictional data. A budget-versus-actual dashboard: total budget, actual spend, variance and budget used, planned against actual by category, cumulative spend, spend mix, and a variance table with actions. Delivered as a fully editable Excel file.
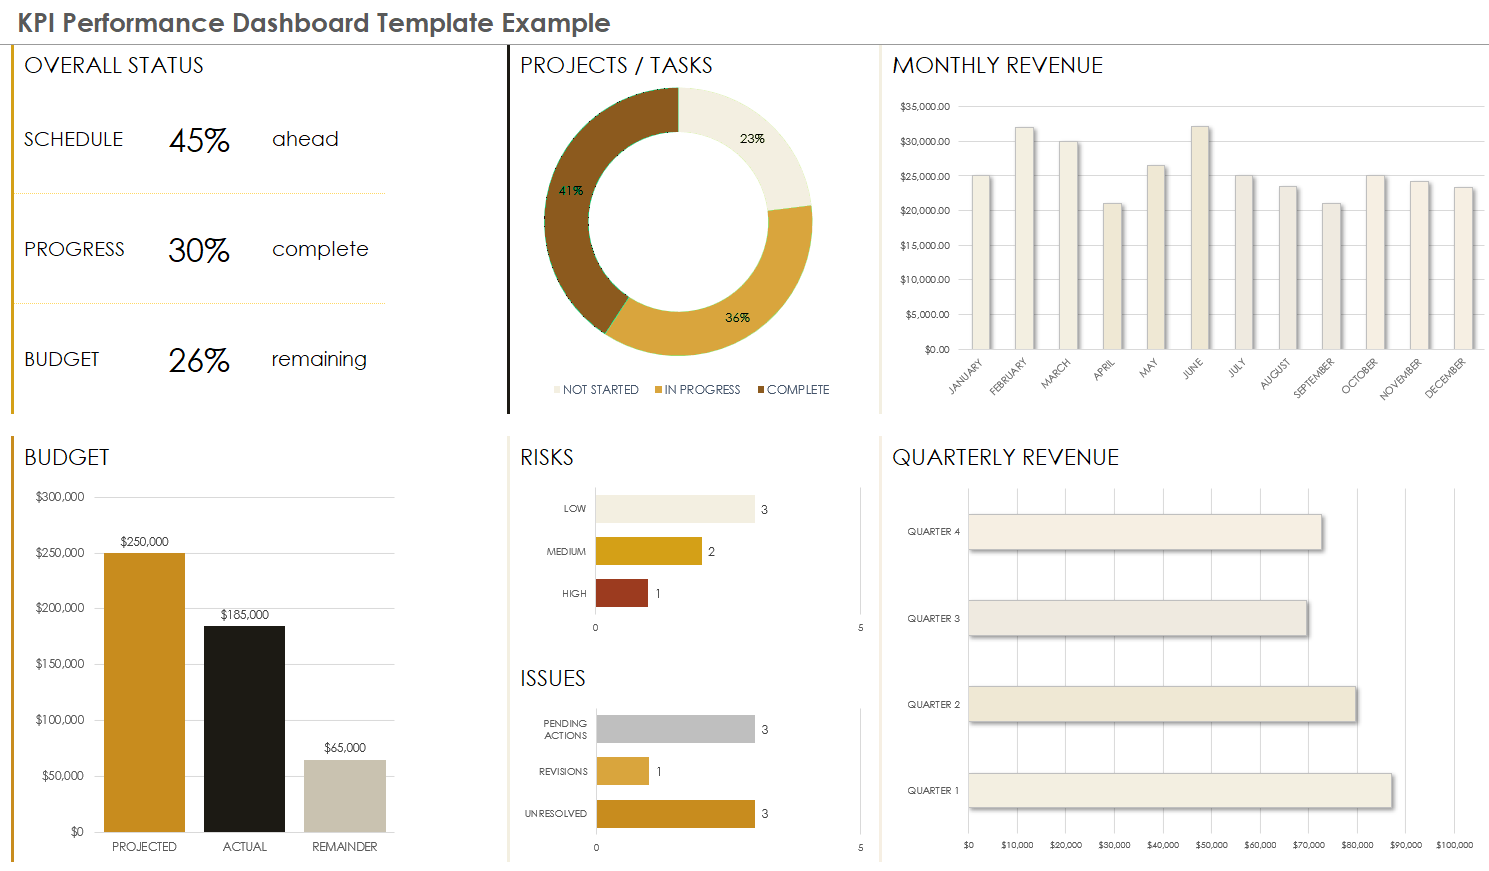
A compact single-page KPI template — schedule, progress, budget, risks and issues at a glance — shown here restyled in DenovaX's own brand colors as a formatting example.